Learning Objectives
Level 6
To be able to demonstrate how to construct a table of values from a linear equation and use these to draw a linear graph.
How can these methods help us in the real world?
Level 7
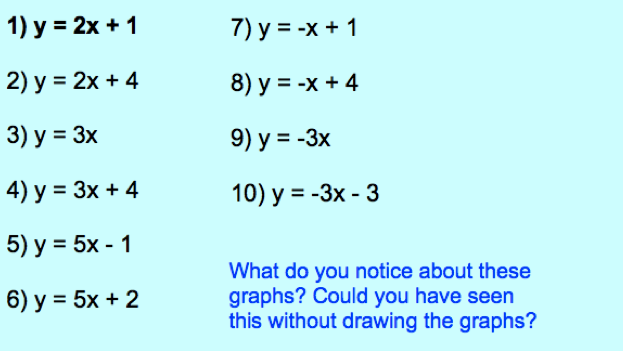
To be able be explain the properties of a graph of the form y=mx+c without drawing the graph and use this information to quickly plot the
graph.
What do the numbers in the equation y=mx+c tell us about the graph?
Resources
Level 6
We are now going to use equations to construct graphs (the first step is to construct a table of values).
Now use WolframAlpha.com to plot the following equations – what do you notice – is there a quick way to plot these graphs?
Flipped


