Driving Question: What are we trying to show and what methods can we use to do this?
Learning Target: To develop skills that will help you investigate a real life problem.
Resources
Sections of your report
Your Statistics project is worth 25% of your final grade. It is marked out of a total of 40 marks, split into sections as detailed below.
- Planning (10 marks)
- Data Collection (8 marks)
- Processing, analysing & representing data (12 marks)
- Interpretation & discussion of results (10 marks)
Grade C: 21
Grade B: 24
Grade A: 28
Helpful guides
Climate - Student Guide
Example Controlled Assessment Plan
PiXL student guide to Controlled Assessment
Met Office
UK Climate Data
Lesson
Driving Question: What is the probability of picking a red counter from a bag if you know the probability of not picking it is 0.65?
Learning Targets
Beginning
To be able to calculate the probability of outcomes of single events and understand that the probability scale runs from 0 to 1.
To be able to calculate the probability of an event happening when you know the probability that the event doesn’t happen and knowing when you cannot use this rule.
Developing
To be able to calculate all the outcomes of two independent events (such as tossing a coin & throwing a dice) and calculate probabilities from lists or tables
Mastering
To be able to use a tree diagram to show all possible combinations. To be able to solve problems using tree diagrams.
Resources
Beginning
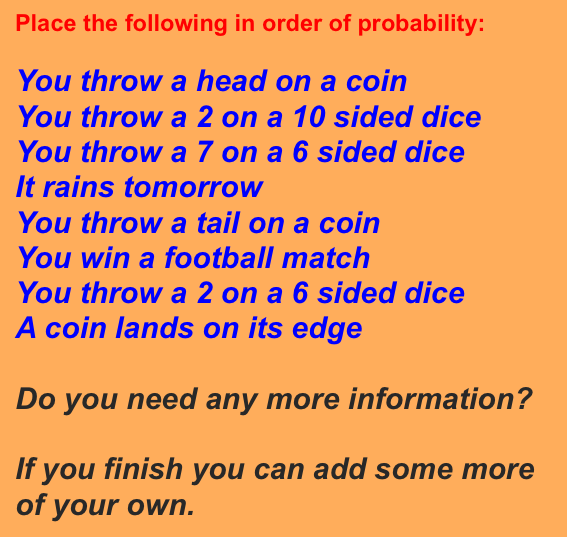
Simple probability examples:
B2
Stick on Maths - Probability (open in Keynote)
B3
B4
B5
Stick on Maths - Probabilities add to 1 (open in Keynote)
B6
Developing
D1
Mastering
M1
M2
M3
Introduction to tree diagrams
M5
Solving problems with tree diagrams


